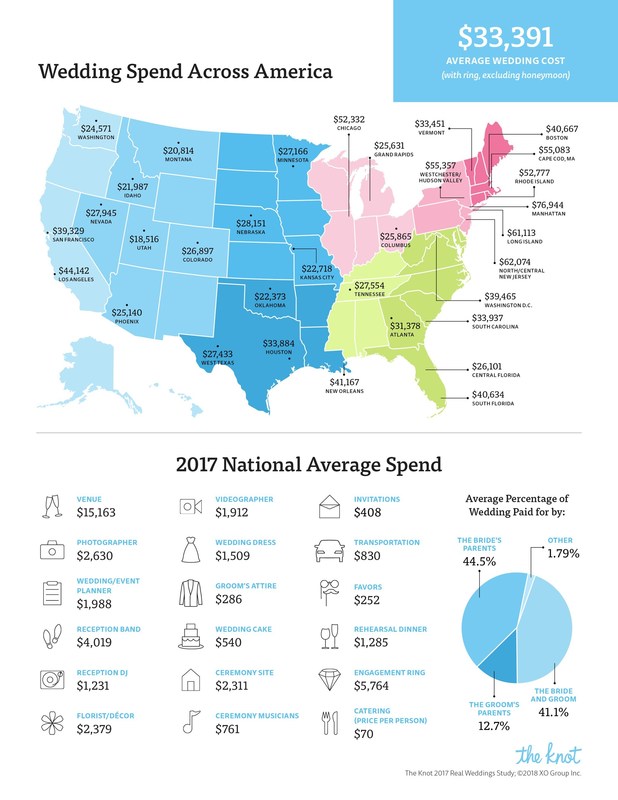
Couples in Rhode Island spend an average of $52,777 on their nuptials, far ahead of the national average, but still far below that of New York City.
The Knot, a digital wedding brand, Wednesday released the results of The Knot 2017 Real Weddings Study. The 11th annual leading wedding industry report, the most trusted and comprehensive of its kind, surveyed nearly 13,000 US brides and grooms married in 2017 to uncover the financial spending habits and trends of real weddings in America. This study includes national and regional statistics on the average cost of a wedding, wedding vendor cost, how couples budget for their big day, the average number of wedding guests, spend per guest, wedding style trends and other key statistics related to weddings in America.
In 2017, the average cost of a wedding was $33,391, with high spenders—those spending an average of $60,000 or more on their weddings—spending an average of $105,130 on their wedding day. Formal weddings have steadily decreased (20% in 2009 to 16% in 2017), as couples look to nontraditional venues such as barns, farms, historic homes, wineries, museums and parks to bring their personalities to life on their wedding day. Incorporating cultural and religious traditions, such as a Chinese tea ceremony or traditional hora Jewish dance, is also very important to couples. Additionally, spend per guest has increased (from $194 in 2009 to $268 in 2017), while guest count has decreased (from 149 in 2009 to 136 in 2017), as couples aim to create the ultimate guest experience with photo booths, sparklers, selfie stations, games, musical performances, wine and liquor tastings, magicians and more.
"Weddings in 2017 showed us that couples are focused on guests, as we see them pulling out all the stops to create a truly memorable experience for their wedding attendees," said Kristen Maxwell Cooper, editor in chief of The Knot. "Couples are also shifting away from formal affairs to create an experience that's truly reflective of their personalities, and infusing more unique and unconventional ideas—from their venue and invitations to food, entertainment and more." Top 2017 Wedding Statistics
Top 2017 Wedding Trends FORMAL WEDDINGS ON THE DECLINE; NONTRADITIONAL RECEPTION VENUES IN DEMAND Since 2009, formal/black-tie weddings have decreased from 20% to 16%, and ceremonies hosted in a religious institution have dropped significantly, from 41% in 2009 to 22% in 2017. Meanwhile, outdoor ceremonies increased from 39% in 2009 to 52% in 2017. As couples look for more unique, unconventional places to host their weddings, farm, barn and ranch reception venues increased from 2% in 2009 to 15% in 2017, and historic homes rose from 12% in 2009 to 14% in 2017. Banquet halls dropped (from 27% in 2009 to 17% in 2017), as did hotels and resorts (from 18% in 2009 to 12% in 2017) and country clubs (from 13% in 2009 to 10% in 2017). Additional popular nontraditional reception sites include beach houses, wineries, rooftops, museums and parks. Time-honored wedding reception traditions are also seeing a decline, with less than half (49%) of brides doing a bouquet toss (down from 53% in 2016); 37% of grooms doing a garter toss (down from 41% in 2016); and 85% of couples doing a cake cutting (down from 88% in 2016). MOBILE WEDDING INCREASES AS MORE COUPLES ARE PLANNING ON THE GO Couples using smartphones for wedding planning activities increased from 89% in 2015 to 92% in 2017. The most popular smartphone wedding planning activity is browsing wedding gowns (65%). Researching wedding vendors (54%, up from 31% in 2014); using online planning tools (48%, up from 21% in 2014); creating a personal wedding website (31%, up from 14% in 2014); and using an online RSVP service (28%, up from 7% in 2014) are also top-of-mind wedding planning activities on mobile. PERSONALIZATION IS A TOP CONSIDERATION, AS THE BRIDE'S PARENTS PAY FOR A MAJORITY OF THE WEDDING When planning the wedding, couples' most important consideration is cost (72%), followed by the overall look and vibe (69%), and personalization: planning a wedding that's a true reflection of who they are as a couple (64%). How did couples determine their wedding budget? Fifty-four percent spoke to their families about what they were willing to contribute; 41% shopped around and researched to get an idea of costs; and 33% had a dollar amount they absolutely did not want to go over. Who pays for the wedding? Tradition rings true, with the bride's parents contributing the most. On average, the bride's parents contribute 45% (56% for high spenders) of the overall wedding budget; the bride and groom contribute 41% (28% for high spenders); and the groom's parents contribute 13% (15% for high spenders); others account for the remaining 2%. In 2017, 10% of couples paid for the wedding entirely by themselves (4% for high spenders), and 9% of couples (16% for high spenders) didn't contribute any finances to the wedding budget. Most couples, 92% (96% for high spenders), say the economy did not affect wedding plans, and 45% (51% for high spenders) report spending more than they planned, with the average couple overspending by $7,319. Fifty-one percent of high spenders went over their budgets by an average of $20,417. COUPLES CREATE THE ULTIMATE GUEST EXPERIENCE AS GUEST SPEND RISES, WHILE GUEST COUNT DROPS Couples continue to focus on creating an amazing guest experience, with 72% saying it was very important their guests were entertained at their wedding. Furthermore, the average number of wedding guests in 2017 is down to 136, compared to 149 in 2009, while the cost per wedding guest is up to $268, compared to $194 in 2009. To create a completely memorable experience for guests, couples are spending on entertainment and personalization. Custom guest entertainment has more than tripled—from 11% to 40% since 2009—with photo booths (69%), sparklers (24%), selfie stations or video booths (22%), games (19%), candy bars (13%), bonfires (12%) and musical performances (12%) present at weddings. Also on the rise are fireworks, dance performers, cigar rolling stations, wine and liquor tastings, and magicians. The most popular guest entertainment for high spenders include photo booths (73%), sparklers (23%), musical performance, (18%) and selfie stations or video booths (18%). CULTURAL AND RELIGIOUS TRADITIONS ARE ABUNDANT Aside from their personalities, it's important to couples to infuse their culture and religion into their celebration. Twenty-one percent of couples incorporated cultural elements into their wedding, including examples such as a Chinese tea ceremony; flamenco guitarist; Irish step dancers and bagpipers; ceremonial readings in Italian and Polish; traditional Jewish hora dance; Moroccan belly dancers; Hawaiian lei exchanges; a reading from a Lebanese poet; traditional Hindu ceremony; 1,000 Japanese paper cranes for décor; Persian honey ceremony; African-American jumping the broom tradition; Cuban cigar rolling station; and more. SOCIAL MEDIA AND WED TECH HELP CAPTURE EVERY MOMENT Couples are using social media more than ever to tell their personal story from the moment they get engaged. Thirty-eight percent of couples shared photos and details on social media within minutes or hours of their engagement, and 25% shared the next day. Sixty-four percent created a custom wedding hashtag and shared it with guests on their personal wedding website (50%), table tent cards (26%), wedding invite (18%), save-the-dates (18%) and ceremony program (16%). Twenty-three percent created a custom Snapchat filter, 10% had drones capture footage from above, and 9% had a photo-sharing app for guests to upload photos into one place. By the day after the wedding, 45% of couples shared wedding photos and details on social media, and 48% updated their relationship status to "married" on Facebook. SUMMER AND FALL TIE AS THE MOST POPULAR WEDDING SEASONS Each year, fall and summer are neck and neck for the most popular wedding season. In 2017 they were tied, with 37% having a wedding in either summer or fall. September takes the lead as the most popular wedding month (16%), followed by June (15%) and October (14%). Saturday weddings are still the number one pick, while Friday weddings increased 1 point to 15% and Sundays see 12% of weddings. COUPLES HAVE BIG PLANS FOR THE FUTURE Once they're married, couples have specific immediate and long-term goals they want to accomplish. One year after the wedding, couples' top priority is planning a vacation (62%), followed by trying to live a healthier lifestyle (60%), and combining finances (55%). Two to three years after the wedding, a majority of couples plan to start a family (35%); purchase a new home (24%); purchase or lease a new car (21%); pay off credit cards or student loans (17%); and buy or adopt a pet (16%). Four years after the wedding, purchasing a second home/vacation property (24%) and setting up a tuition savings account for children (24%) are the biggest priorities for couples. Top 25 Most Expensive Places to Get Married Based on average cost of a wedding in 2017, couples spend the most on their weddings in the following areas in the US.
Top 10 Most Affordable Places to Get Married Based on average cost of a wedding in 2017, couples spend the least on their weddings in the following areas in the US.
Notable Regional Differences
The Knot 2017 Real Weddings Study can be broken down on a region-by-region basis across more than 80 markets. Regional highlights include:
|
WBOB
|


Search For Your Favorite WBOB Author,
or BobCast
990WBOB
An Independent Media Outlet.
The views opinions and thoughts expressed do not reflect those of 990WBOB, its management or its staff. All Rights Reserved 990WBOB.com 2007-2020
Contact WBOB HERE
An Independent Media Outlet.
The views opinions and thoughts expressed do not reflect those of 990WBOB, its management or its staff. All Rights Reserved 990WBOB.com 2007-2020
Contact WBOB HERE